Dashboards & Analytics
Track Projects, KPIs, and Performance in One Place.
Turn Your Work Into Real-Time Insights
Aiworkk Dashboards transform everyday work into clear, actionable insights. Track projects, milestones, KPIs, workloads, risks, and performance across your organization — all from a single, customizable workspace.
Bring together charts, metrics, timelines, and progress tracking so teams and leadership always know what’s happening and what needs attention next.
Analytics & KPI Tracking
Monitor Performance in Real Time
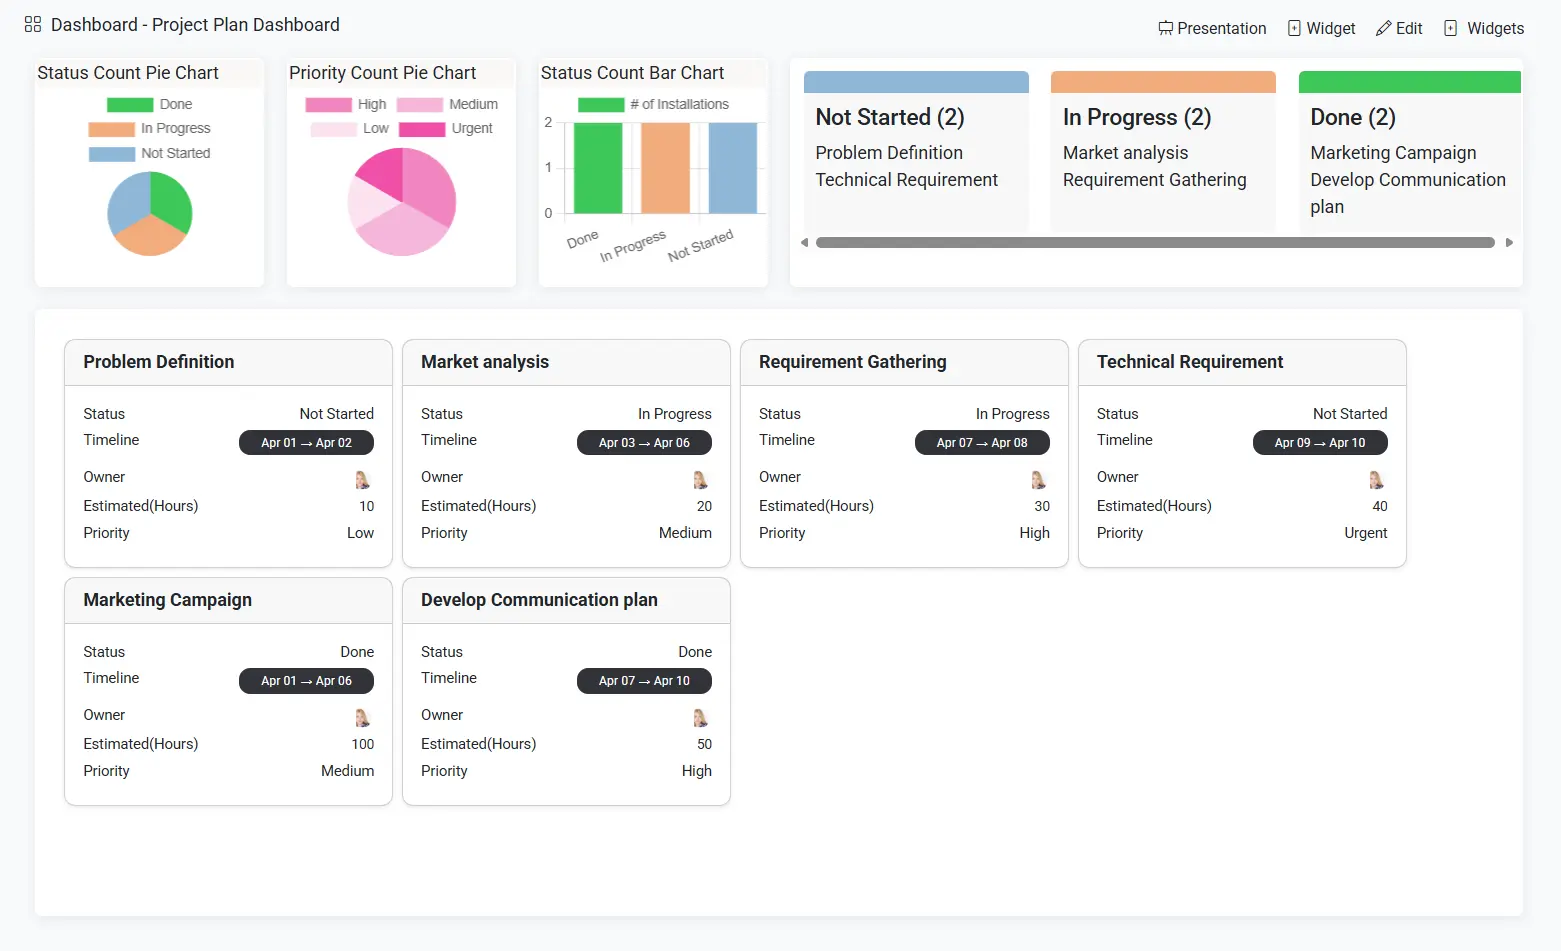
Track analytics, milestones, and KPIs across projects, teams, campaigns, operations, and business workflows. Aiworkk dashboards provide a live overview of organizational performance using data directly from your boards and workflows.
Key Features:
- Real-time project and operational analytics
- KPI monitoring and milestone tracking
- Progress visualization across boards and teams
- Status, workload, and completion insights
- Timeline and performance reporting
- Executive-level reporting dashboards
- Cross-board reporting and summaries
Make Faster Decisions. Improve Team Alignment. Identify Risks Early. Track Goals With Confidence.
Flexible Widget Center
Build Dashboards Your Way
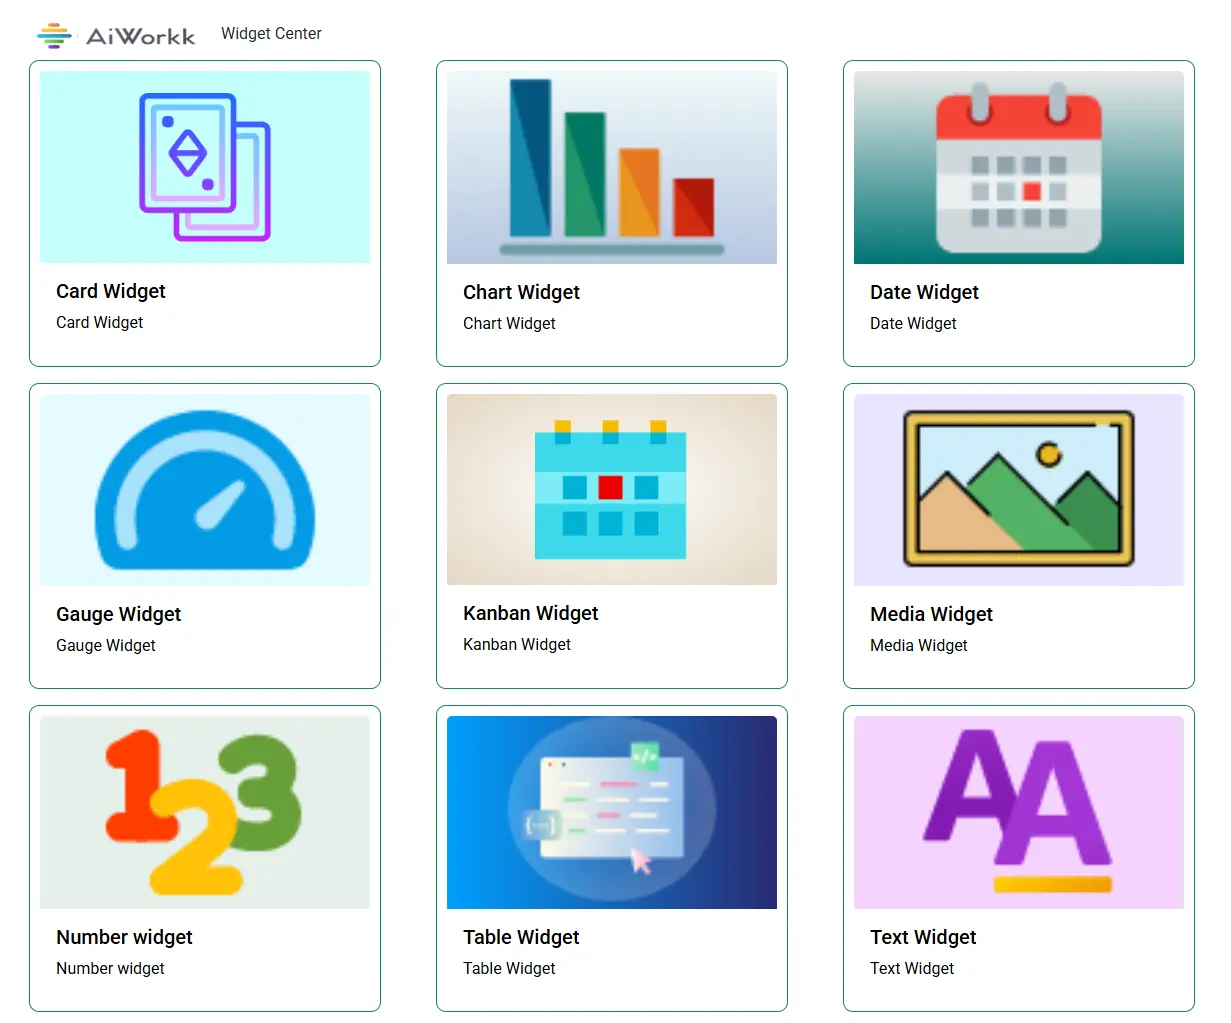
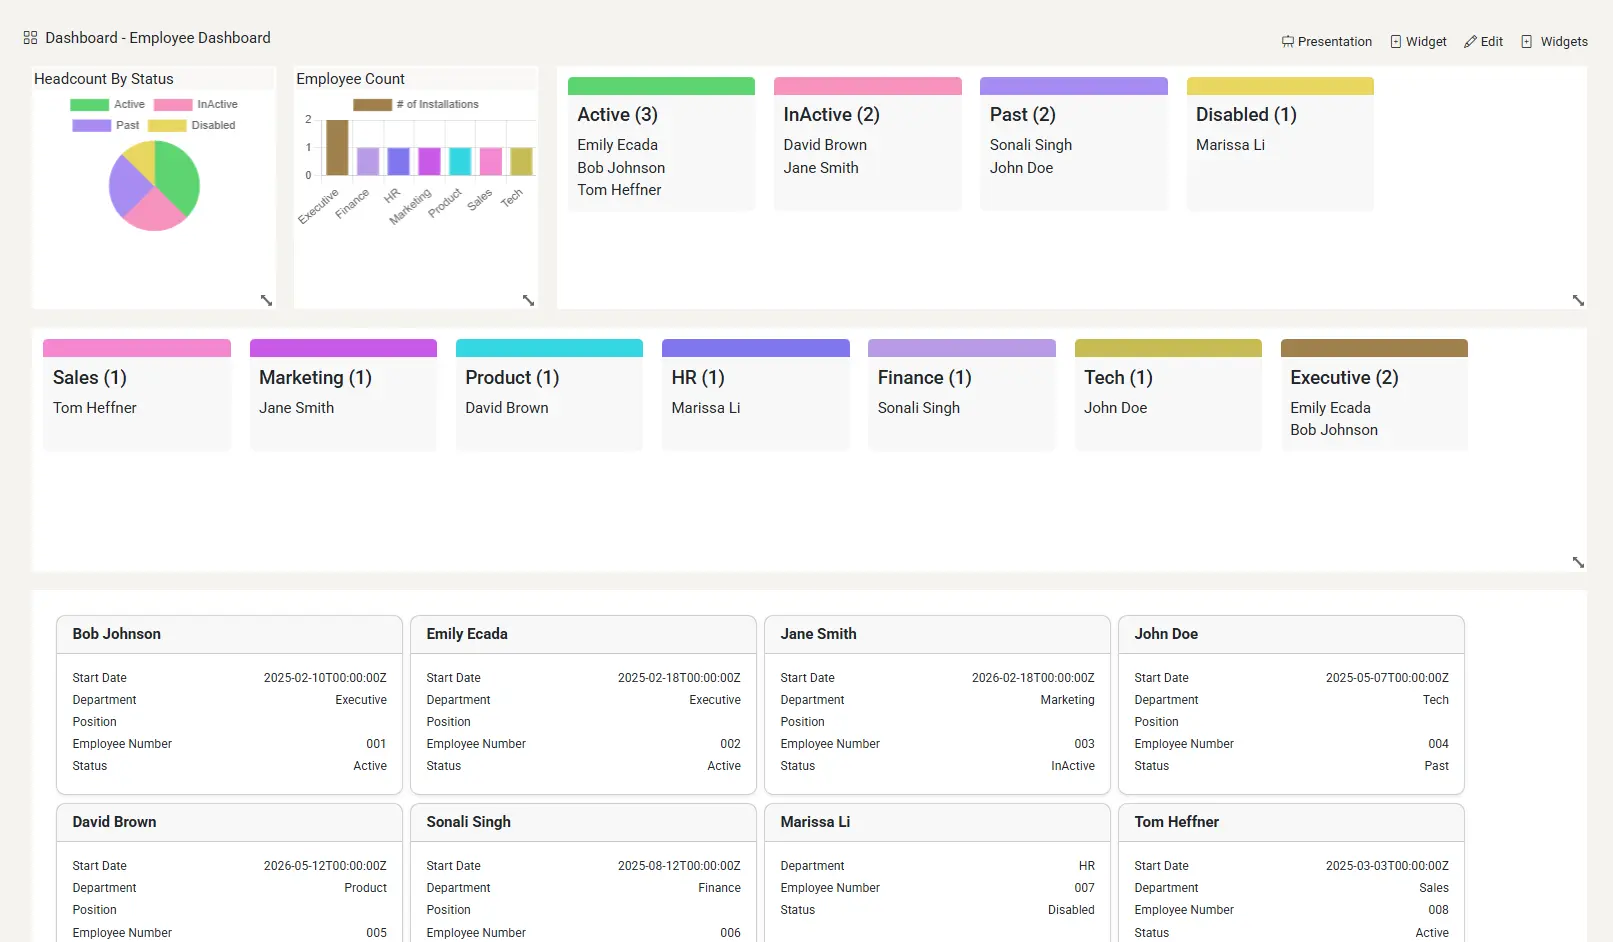
Aiworkk gives teams complete flexibility to design dashboards that match their exact reporting needs. Combine multiple widget types into a powerful visual command center for work management and analytics.
Available Widget Types:
- Pie charts
- Bar charts
- Line charts
- KPI widgets
- Progress Gauges
- Table Widgets
- Card Widgets
- Timeline Widgets
- Image Widgets
AI Dashboard & Widget Builder
Create Dashboards with AI
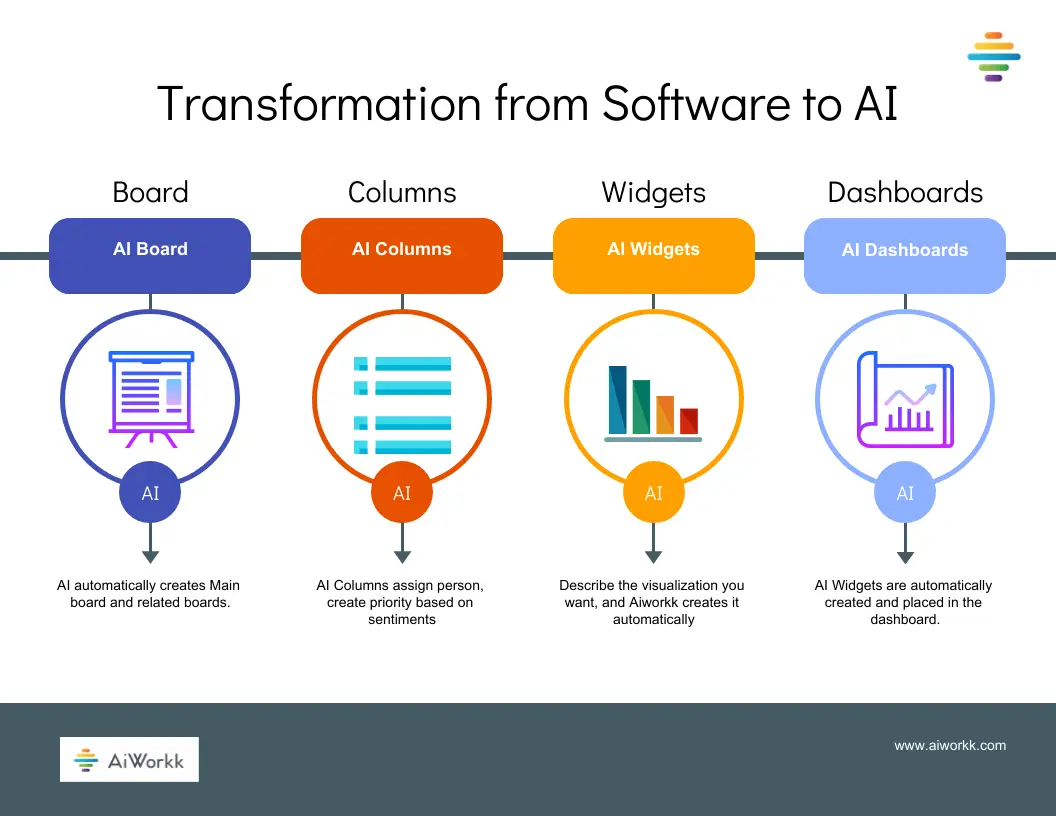
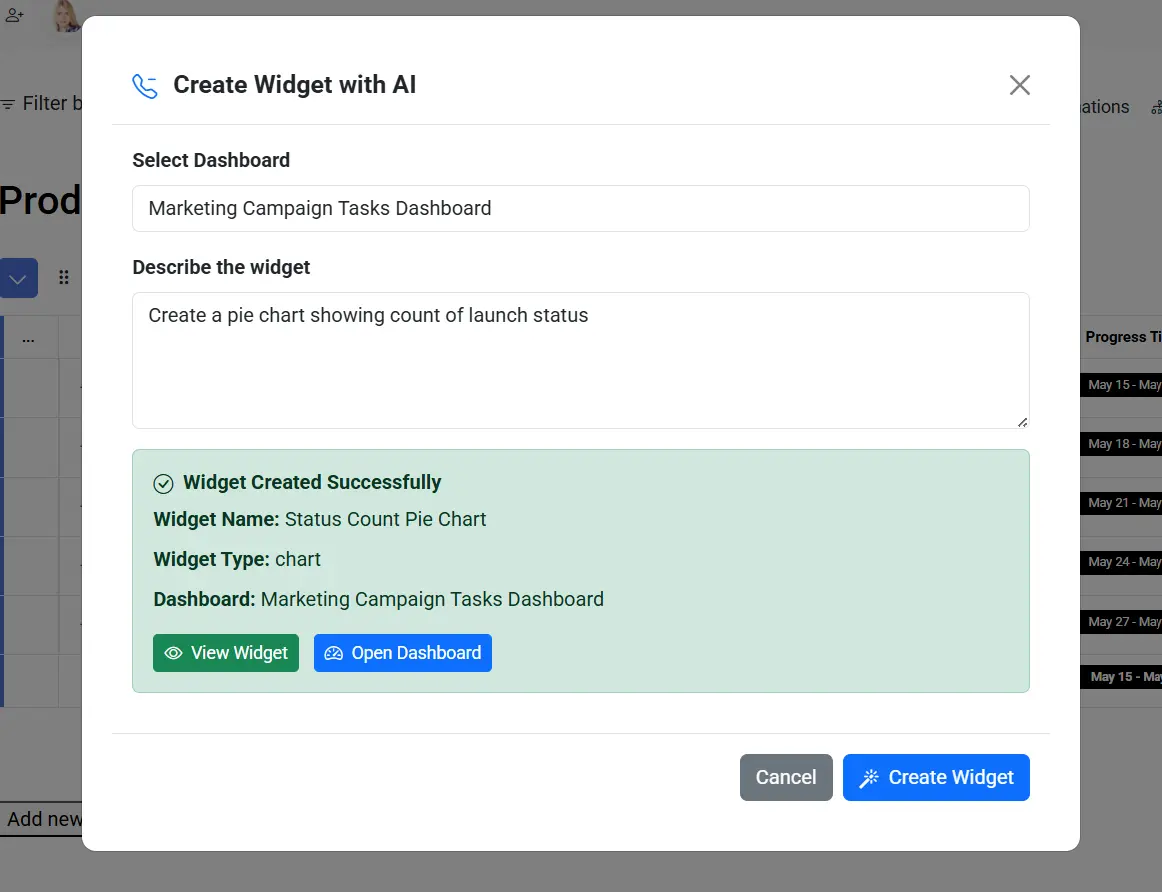
Aiworkk AI can automatically generate widgets and dashboards from simple prompts. Describe the visualization you want, and Aiworkk builds it instantly using your existing board data.
Example Prompt:
“Create a pie chart showing count by each project status.”
Aiworkk automatically:
- Understands the data structure
- Selects the correct visualization
- Creates the widget
- Adds it directly to the dashboard
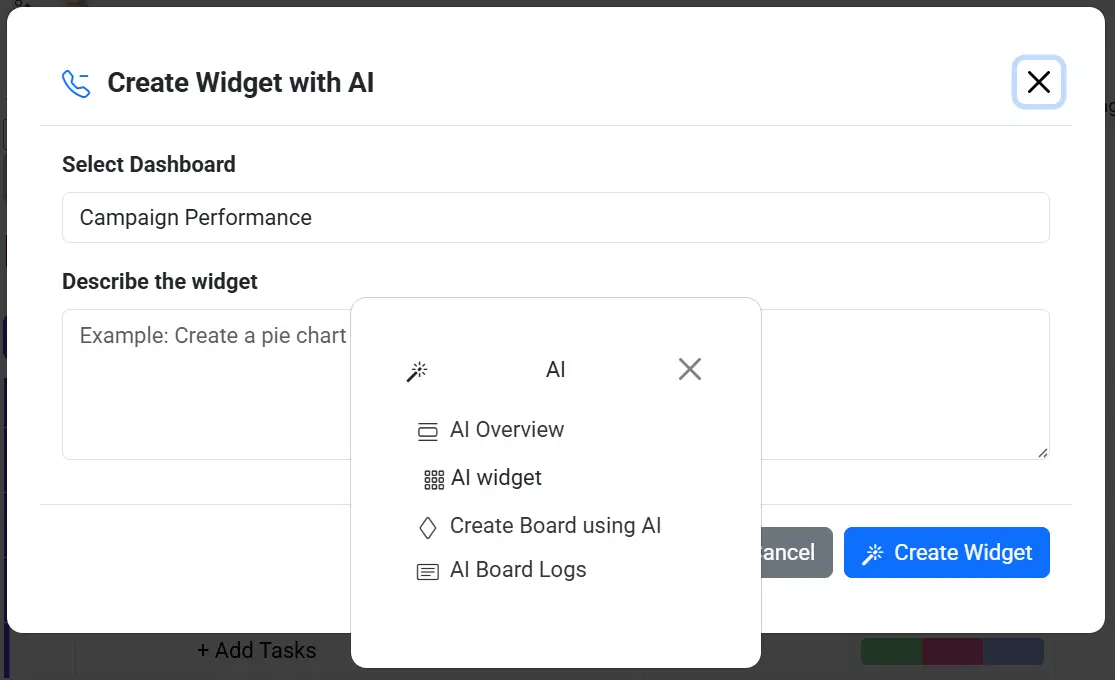
AI Widget Builder Workflow
Step 1 — Select Dashboard
Choose the dashboard where you want the widget added.
Step 2 — Describe the Widget
Enter a natural language prompt describing the visualization.
Step 3 — AI Generates the Widget
Aiworkk automatically creates and configures the widget using your board data.
Step 4 — Dashboard Updates Instantly
The widget appears directly in your dashboard, ready to use and customize.
Benefits:
- Build Reports Faster
- No Technical Skills Required
- Reduce Reporting Overhead
- Accelerate Decision-Making
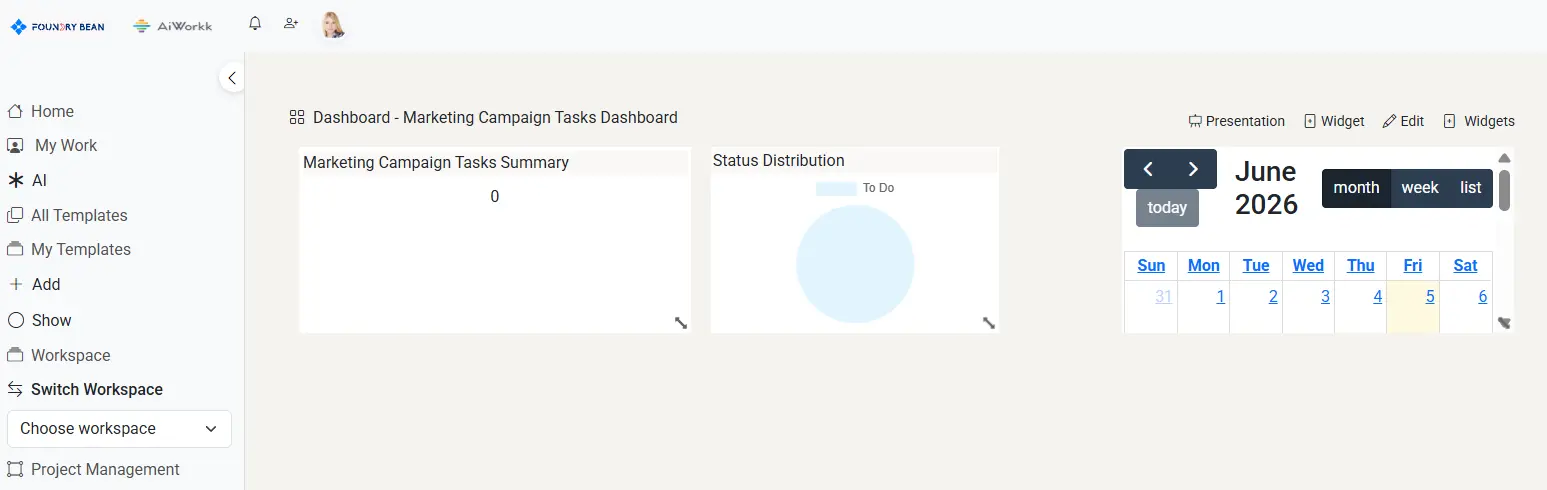
AI Dashbaord
AI Widgets are automatically created and placed in the dashboard of your choice.
You can add additional manual widgets in the dashboard.
Why Teams Choose Aiworkk AI
Faster Setup
Create complete workspaces in minutes instead of days.
Intelligent Execution
AI assists teams with prioritization, summaries, assignments, and recommendations.
Connected Workflows
Link boards, dashboards, tasks, and insights together automatically.
Executive Visibility
Get AI-powered reporting and risk analysis without manual preparation.
Scalable Collaboration
Support startups, agencies, enterprises, and cross-functional teams from one platform.
AI assists teams with prioritization, summaries, assignments, and recommendations.
Connected Workflows
Link boards, dashboards, tasks, and insights together automatically.
Executive Visibility
Get AI-powered reporting and risk analysis without manual preparation.
Scalable Collaboration
Support startups, agencies, enterprises, and cross-functional teams from one platform.